
- Topics
- Release Information
- X-Sign Quick guide
-
X-sign User manual
- Account (4)
- Licence (4)
-
Manager (15)
- Pairing the device with X-Sign Manager
- Creating the channel
- Scheduling the content by channel
- Scheduling the content by device
- Editing the device management structure
- Pushing Real-Time Message to your BenQ Smart Signage remotely
- Controlling the device remotely
- Updating device Player remotely
- Managing the calling system
- Creating an API table in X-Sign Manager
- Setting Verification
- Getting the system notification
- Updating device status immediately New
- Player report (proof-of-play) New
- Using Designer Express New
-
Designer (18)
- Creating a new project file in X-Sign Designer
- Uploading your content from Designer
- Creating content in X-Sign Designer
- Creating content from Designed Templates
- Creating a clock widget in X-Sign Designer
- Setting a weather widget
- Creating an Image or Video slideshow
- Rotating an image or video
- Generating a QR Code
- Adding a data connection
- Setting a timer widget
- Creating an API template using the demo kit
- Creating a TV Input source widget in X-Sign Designer
- Setting background music in X-Sign Designer
- Changing the playing order of pages
- Sealing a file in X-Sign Designer
- Opening an X-Sign 1.x project file
- Changing your language in X-Sign Designer
- Player (6)
- Local Delivery (3)
- Report (2)
- Video Wall (3)
- Interactive (Premium) (6)
- API (Premium) (1)
- GPL/LGPL Software Licenses Used by X-Sign
- X-Sign OpenAPI
X-Sign User Manual
In this section, we'll explain how to manage content in X-Sign, control the player, and set up playlists.
X-sign 2.0 / X-sign User manual / Interactive (Premium)
Enabling Interactive Statistics
2020 / 08 / 25
For X-Sign Designer, interactive projects can record the touch statistics of each page within an interactive project. The following is an introduction to enabling and reviewing interactive statistics.
Note: This feature is for BenQ members who have purchased a Premium License only.
To enable the interactive statistics for an interactive project:
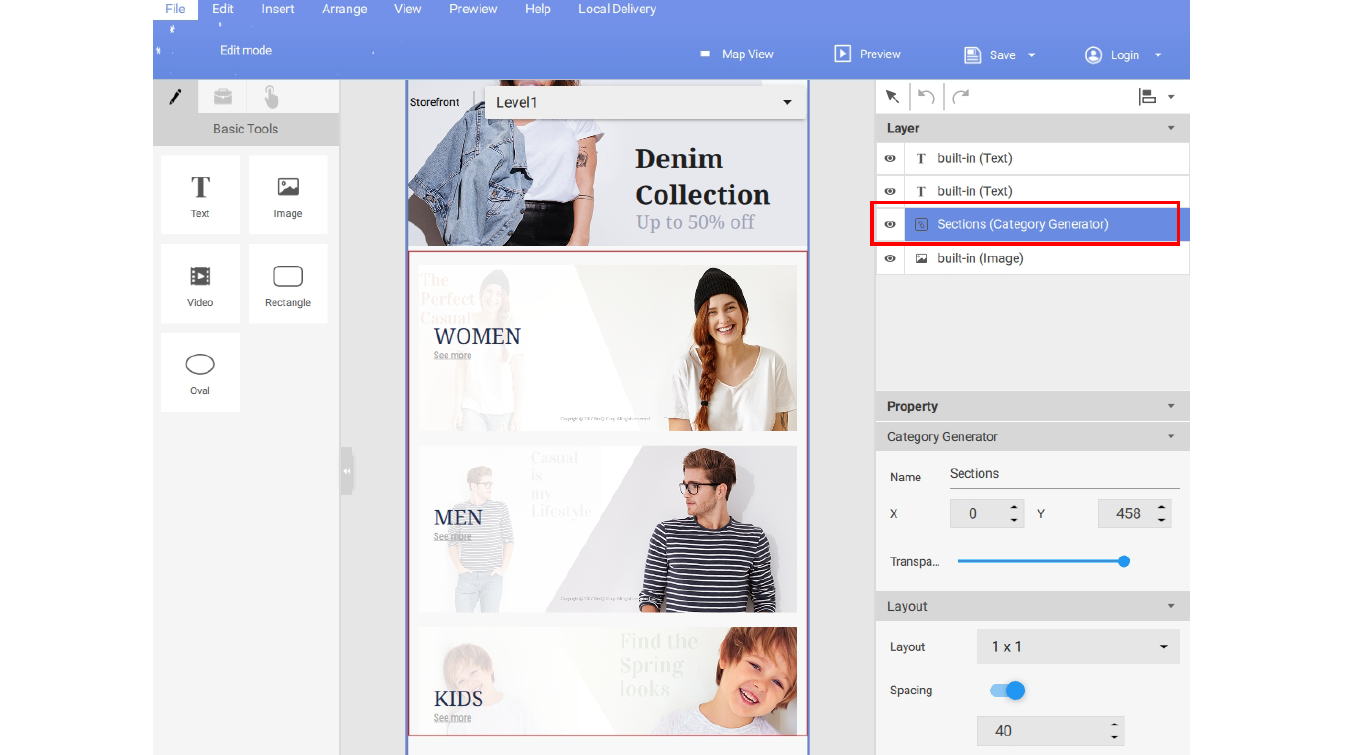
1. Navigate to the desired Content Page in Level 1 or Level 2, then double-click the Category window on the canvas.
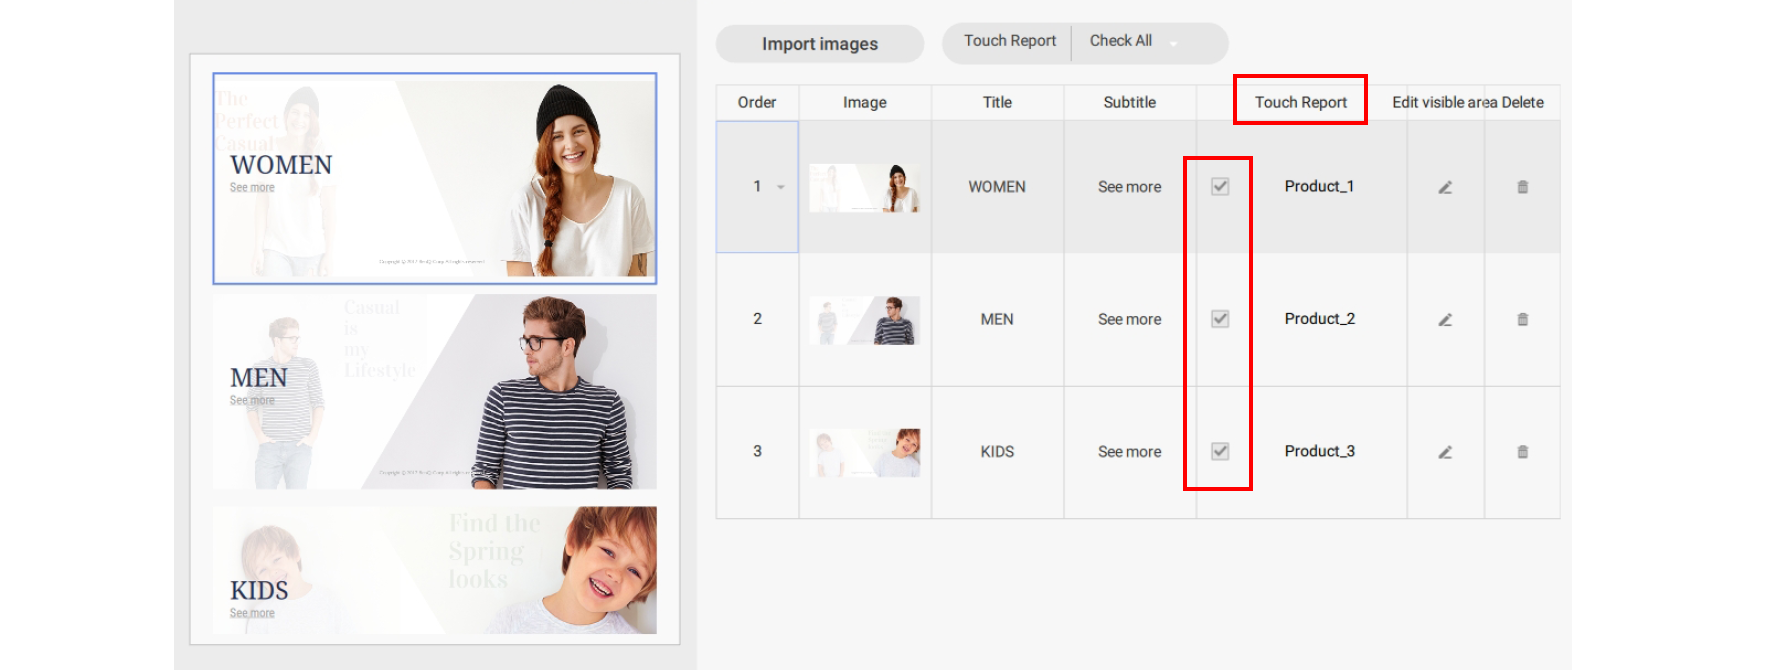
2. Under the Touch Report column in the Category Generator window, select the checkbox next to each item you wish to track touch data.
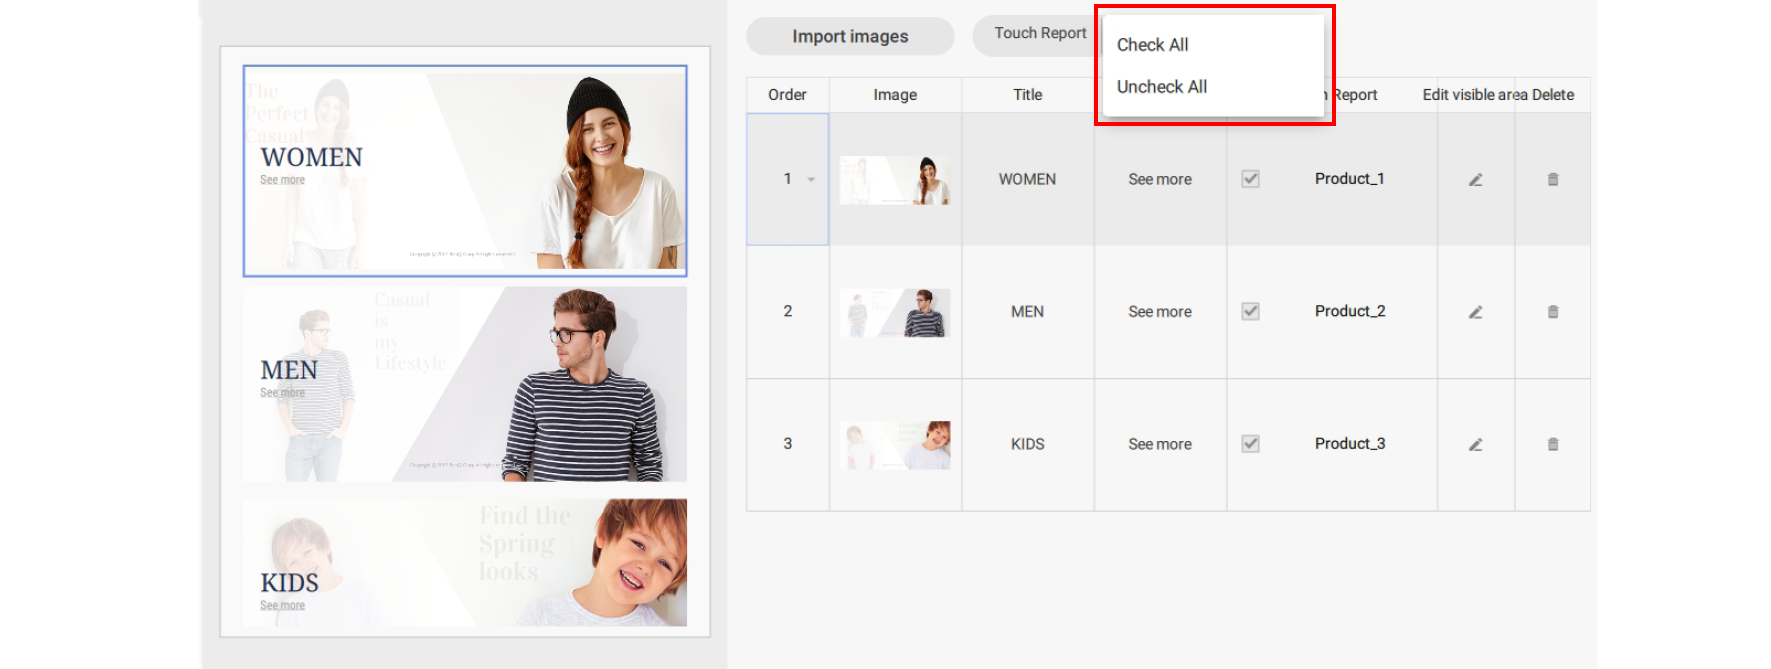
3. You can also change the Touch Report settings for all categories by clicking the botton in the Touch Report drop-down menu. Select Check All to generate Touch Report data for all categories or select Uncheck All to not generate Touch Report data for any categories.
Note: To review the interactive statistics, refer to Viewing an Interactive Report on page 139 for more information.