{{item.name}}
Price: {{currency}}{{item.price| numberThousandsCommas | numberDecimalPoint}}
Qty: {{item.amount}}
Remote Work & Learning
Projector
Monitor
Lighting
Interactive Display | Signage
Remote Work & Learning
Store
One very different aspect of professional monitor like the BenQ PhotoVue Photographer Monitor SW series and DesignVue Designer Monitor PD series compared to consumer monitors is that every professional monitor comes with a factory calibration report. Why is the report included in the box? Why is it important? How should you read the report? These questions have been raised quite often and we believe it is necessary to let our users understand the underlying logic..
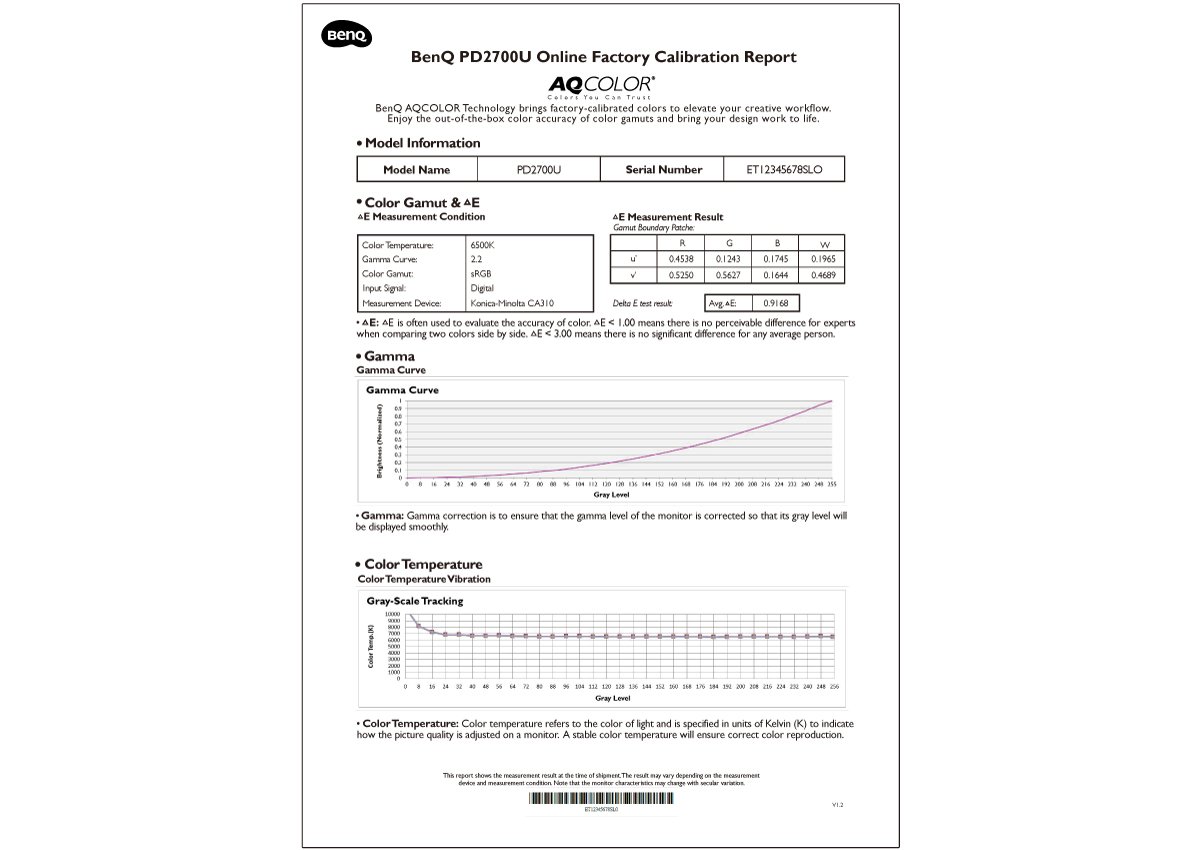
Let’s begin with the importance or significance of the factory calibration report. Every BenQ Photographer/Designer monitor passes a rigorous factory calibration process. But how to prove it was done, and how to show how well it was carried out? This is where the factory calibration report comes in. The main purpose of the report is to show the results of the factory calibration process of the monitor with the listed serial number. Therefore, it is considered as proof of the calibration results. A sample factory calibration report for a BenQ Designer Monitor PD2700U is shown in Figure 1.
Figure 1: Sample PD2700U Factory Calibration Report.
There are many check items in the calibration report. Each check item will be explained in more detail in the following paragraphs. When we examine each check item in Figure 1, for example the gamma curve, we find there are two lines in the diagram. One line represents the target value and another line represents the actual measured value. Therefore, this report can also show the performance of the factory calibration process. As a result, we don’t need to take out the monitor and measure the optical characteristics again. By examining the report, we can have a very good idea of how the monitor behaves. In short, the importance of the calibration report is to provide proof that the factory calibration process has been done. The report also shows the performance of the monitor after calibration. So, the user does not need to re-measure the monitor to determine optical characteristics.
Inconsistent Color?
Upsets more than you'd expect
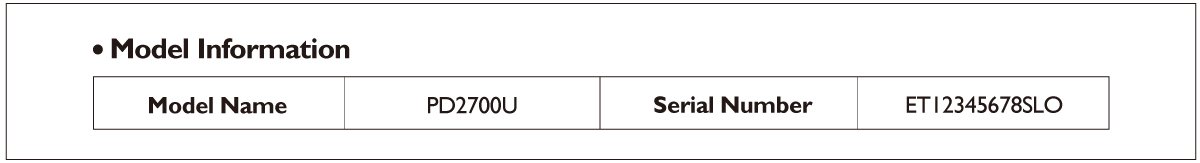
Now, let’s take a closer look at the BenQ DesignVue Designer Monitor PD series calibration report. At the very top of the report there's ‘Model Information’, where the model name and monitor serial number associated with the report will be reported, as shown in Figure 2. The calibration report is based on each individual monitor, so the serial number is used to match between the report and the monitor. Each report is unique since it is reporting different monitors’ measurement results.
Figure 2:Model Information Section in PD Series Calibration Report
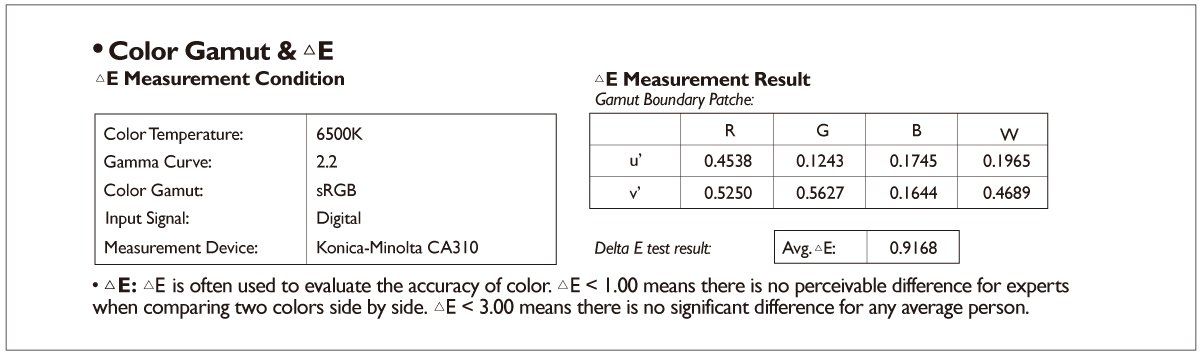
The second part of the report is ‘Color Gamut & Delta E’. In this section, it describes the measurement condition, the u’v’-color coordinates (or x,y–color coordinates) of the red, green, and blue colors as well as the white color and the average Delta E of the standard BenQ test patch set. A sample of this section is shown in Figure 3.
The monitor was first calibrated to a specific set of conditions as stated in ‘Delta E Measurement Condition’: 6500K color temperature, gamma 2.2, sRGB color gamut, and using digital input. The measurement device used to conduct all measurements is a Konica-Minolta CA310. The color gamut is defined by red, green, and blue colors in-monitor, hence the u’v’-color coordinates (or x,y–color coordinates) are reported along with white in ‘Gamut Boundary Patches’ to report the color gamut of the monitor and the white point.
Average Delta E is also reported under ‘Delta E test result’. Average Delta E is calculated based on the standard BenQ test patch set, which consists of 39 unique test colors. Delta E is called ‘color difference’, and is an index to indicate how different a test color is from a reference color. In this case, we use the measurement values to compare to the 39 reference values of the test colors and obtain the average Delta E value. There are many versions of Delta E, the version used here is Delta E 2000, which gives meaningful results to the numbers as stated in the report: Delta E is often used to evaluate the accuracy of colors. Delta E < 1.00 means there is no perceivable difference for experts when comparing two colors side by side. Delta E < 3.00 means there is no significant difference for any average person.
Figure 3: Color Gamut & Delta E Section in PD Series Calibration Report
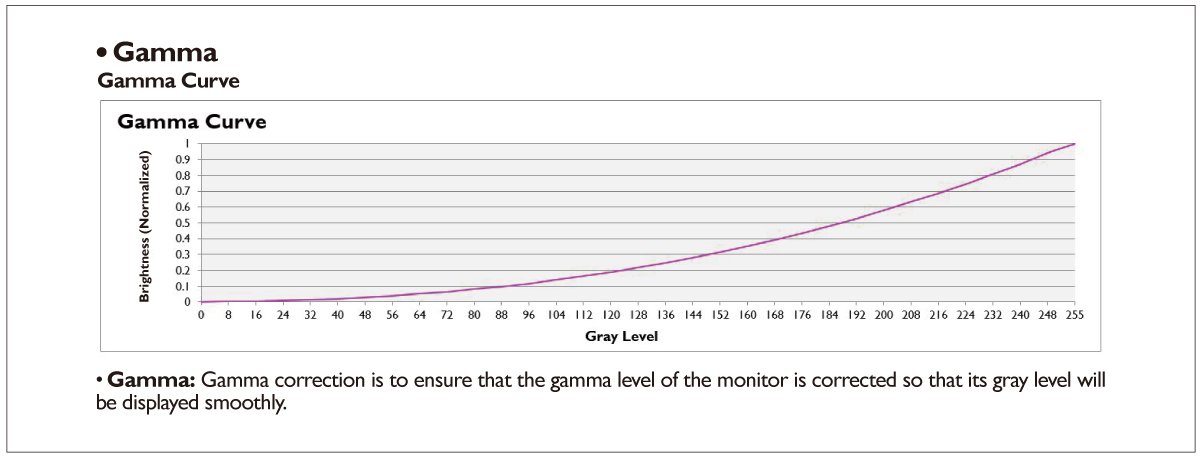
Next on the calibration report is the ‘Gamma’ section. A sample of this section is exhibited in Figure 4. The calibrated gamma curve and the target gamma curve are both plotted on the diagram. The target gamma curve is gamma 2.2. A gamma curve can be described as how smoothly black transits to white on a digital display. During the factory calibration process, a gamma correction process is applied to ensure that the gamma level of the monitor is corrected so that its gray level will be displayed smoothly. Most of the time, the calibrated gamma curve is overlaid with the target gamma curve since we pay special attention to this check item and ensure the gamma curve is calibrated very carefully.
Figure 4: Gamma Section in PD Series Calibration Report
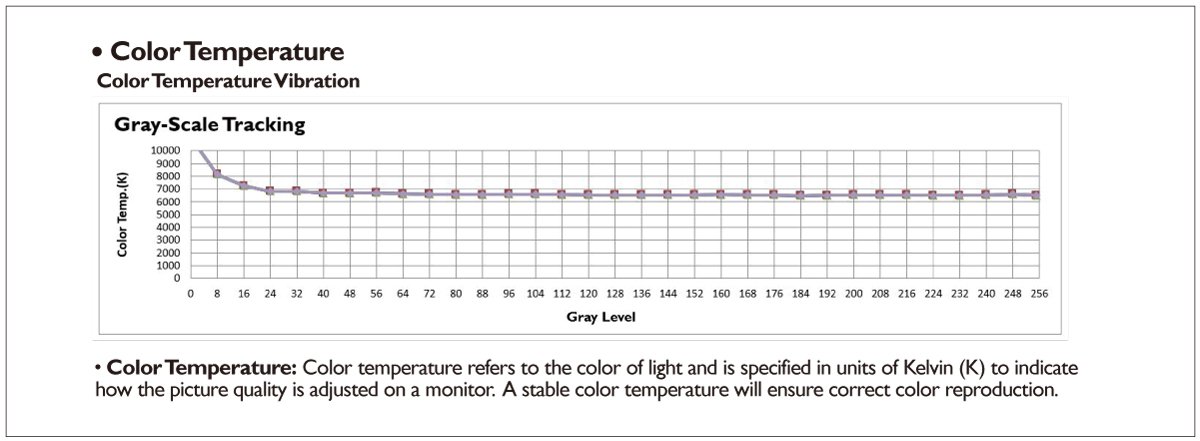
Last on the calibration report is the ‘Color Temperature’ section. A sample of this section is exhibited in Figure 5. Color temperature refers to the ‘tint’ of the white point and usually is reported in units of Kelvin (K). For example, a 3000K white is a reddish or yellowish white, whereas 9300K white is a bluish white. A ‘normal’ white, i.e., white without tint, is defined as 6500K. On the diagram, it not only shows the color temperature of white but also the color temperature of all the grays in the grayscale. This is because it is desirable to maintain the same color temperature across the entire grayscale. Therefore, ideally it should be a horizontal line in the diagram. However, we see a curvature in the dark shadow, due mainly to two factors. First is the nature of liquid crystal displays, and second are errors introduced by the measurement device in the darker region. It is often considered that a measurement below a grayscale of 40 is not reliable and should be overlooked.
However, BenQ believes that true color precision should not be judged merely by surface-level standards. Beyond overall grayscale uniformity management, we implement enhanced control and rigorous verification specifically for the 4–64 grayscale level, which is the most difficult region for human eyes to distinguish and often the most easily overlooked. This ensures smooth and delicate transitions even in the darkest areas—an exacting level of detail that most brands either fail to address or simply choose to ignore.
Figure 5: Color Temperature Section in PD Series Calibration Report
Now we have a better understanding of the PD series calibration report. During the factory calibration process, color gamut, Delta E, gamma curve, and color temperature are adjusted. The calibrated results are reflected on the report. Now, it is time to take a look at the SW series factory calibration report.
Expand Mac® Devices Color Perfection
Looks perfect as you'd expect
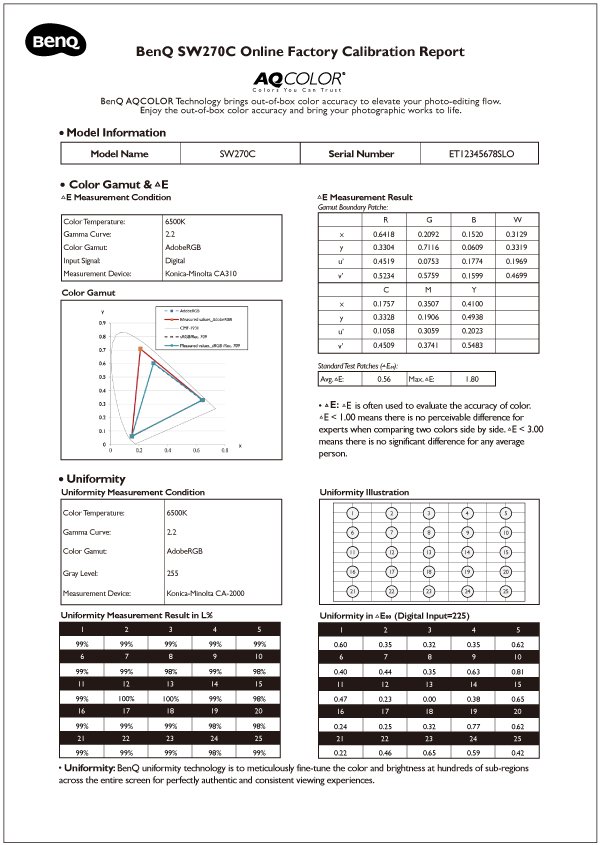
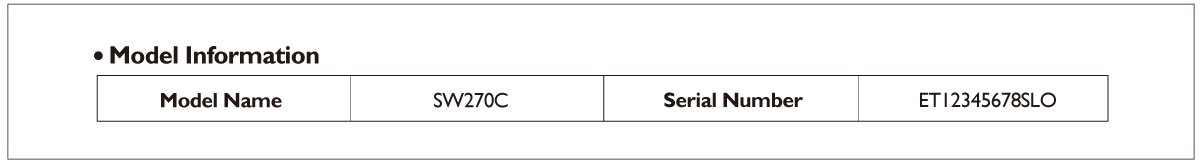
There are two pages in the factory calibration report. So, the information reported for the BenQ PhotoVue Photographer Monitor SW series report is slightly more detailed than that for the BenQ DesignVue Designer Monitor PD series. Let’s take a closer look at the SW series calibration report. A sample SW270C factory calibration report is illustrated in Figure 6. At the very top of the report, we have the ‘Model Information’, where the model name and the monitor serial number associated with the report will be listed, as shown in Figure 7. This section is the same as the PD series report. The calibration report is based on each individual monitor, so the serial number is used to match between the report and the monitor. Each report is unique since it is reporting different monitors’ measurement results.
Figure 6: Sample SW270C Factory Calibration Report
Figure 7: Model Information Section in SW Series Calibration Report
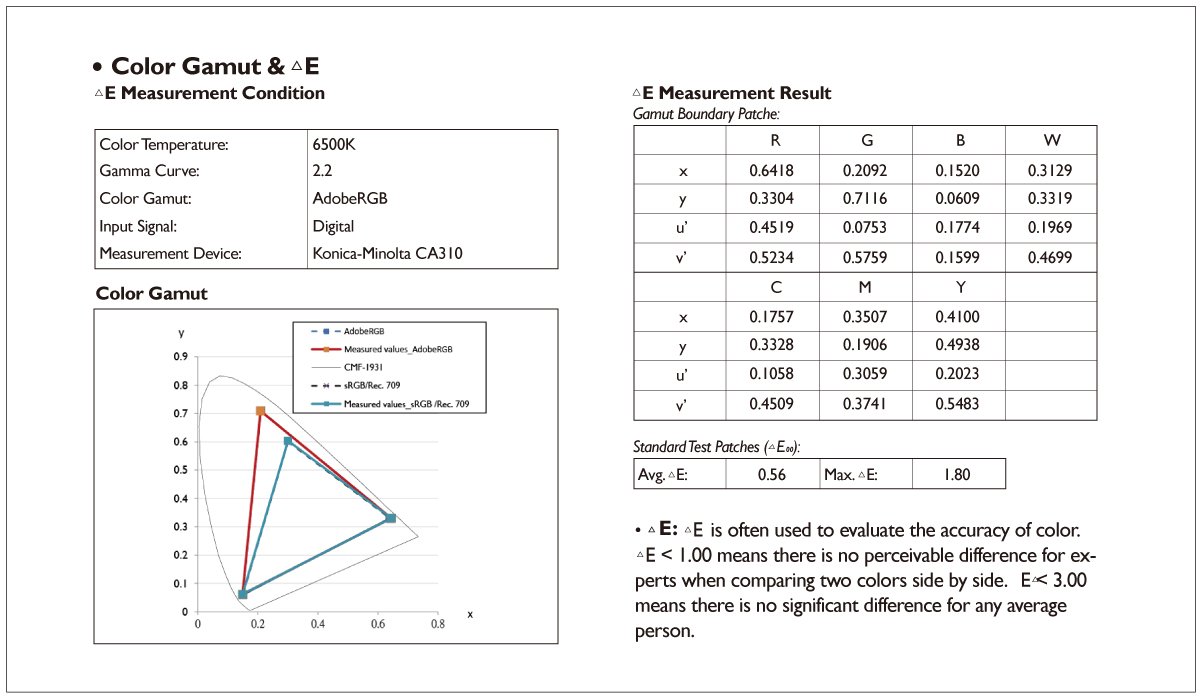
The second part of the report is ‘Color Gamut & Delta E’. In this section, we describe the measurement conditions, the xy-color coordinates, and u’v’-color coordinates of the red, green, blue, cyan, magenta, and yellow colors as well as the white color. The section also shows the average and maximum Delta E of the standard BenQ test patch set. A sample of this section is illustrated in Figure 8.
The monitor was first calibrated to a specific set of conditions, as stated in ‘Delta E Measurement Condition’: 6500K color temperature, gamma 2.2, Adobe RGB color gamut, and using digital input. The measurement device used to conduct all measurements is a Konica-Minolta CA310. The color gamut is defined by red, green, and blue colors in-monitor, so the xy-color coordinates and u’v’-color coordinates are reported along with white in ‘Gamut Boundary Patches’ to show the color gamut of the monitor and the white point. In addition, the xy-color coordinates and u’v’-color coordinates for cyan, magenta, and yellow colors are also reported. A 1931 chromaticity diagram with measured and target color gamuts is illustrated for better visualization purposes.
Average and maximum Delta E are also reported under ‘Standard Test Patches’. Average and maximum Delta E are calculated based on the standard BenQ test patch set, which consists of 39 unique test colors. Delta E is called ‘color difference’, and is an index that measures how different a test color is from a reference color. In this case, we use measurement values to compare to the 39 reference values of the test colors, and obtain an average Delta E value. There are many versions of Delta E, the version used here is Delta E 2000, which gives meaningful results to the numbers as stated in the report: Delta E is often used to evaluate the accuracy of color. Delta E < 1.00 means there is no perceivable difference for experts when comparing two colors side by side. Delta E < 3.00 means there is no significant difference an average person could perceive.
Figure 8: Color Gamut & Delta E Section in SW Series Calibration Report
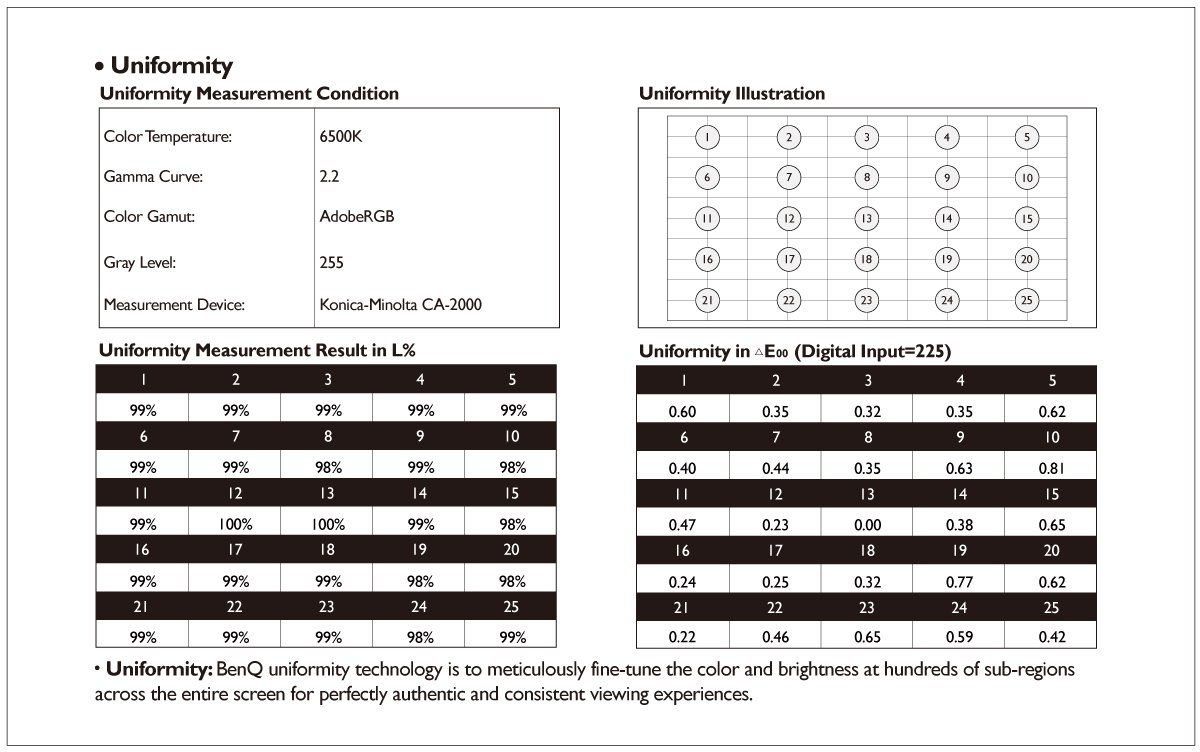
The third part of the SW series calibration report is the ‘Uniformity’ section. Uniformity refers to the evenness of the display area, and whether there are any visible shadows when displaying full white. Color temperature, gamma curve, and color gamut are measured when uniformity correction is turned on. From the sample ‘Uniformity’ section in Figure 9, we can learn that the measurement condition was set at color temperature at 6500K, gamma curve at 2.2, and color gamut at Adobe RGB. The gray level measured was at level 255, which is equal to white. The measurement device utilized was a Konica-Minolta CA-2000.
On the top right corner in Figure 9, there is an illustration showing where the measurement points are taken from the panel. There area total of 25 measurement points taken for uniformity in terms of L% and Delta E. But when adjusting uniformity, not only the 25 points were adjusted, but hundreds of sub-regions were adjusted carefully using BenQ proprietary technology. All 25 measurement data points are compared to the center measurement point, which is labelled no. 13, individually. Hence, the measurement result in L% (which means luminance) at no.13 will always be 100%, and the Delta E at no. 13 will always be 0.00. From the sample uniformity data, we can see that monitor luminance is quite uniform, with a 2% variation. And Delta E is also less than 1, therefore, there is no visible coloration or tint when displaying a full white.
Figure 9: Uniformity Section in SW Series Calibration Report
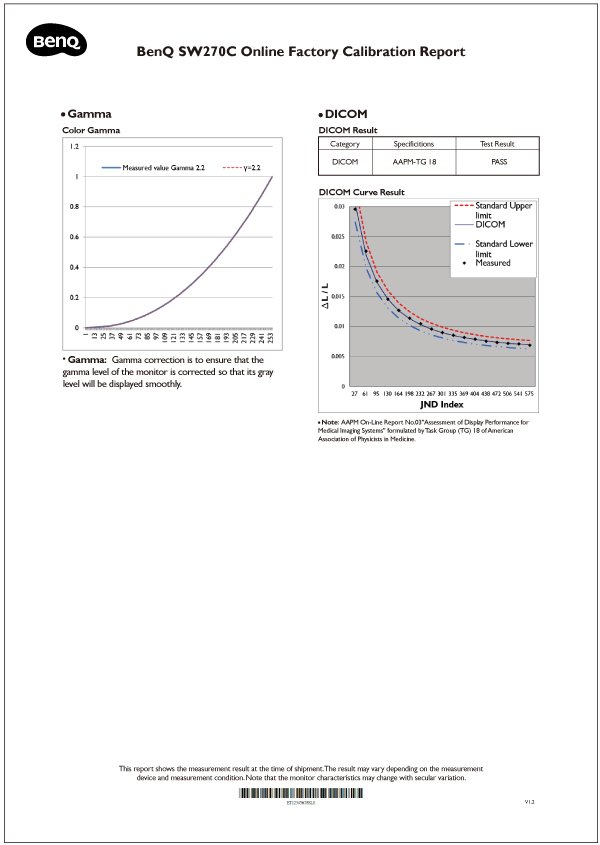
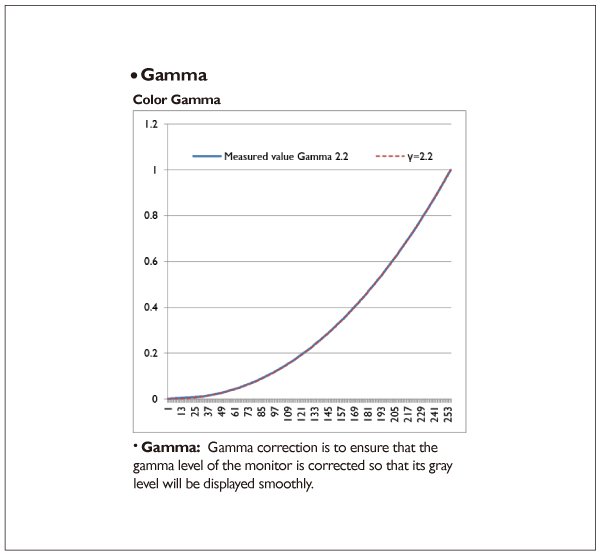
Next on the calibration report is the ‘Gamma’ section. A sample of this section is exhibited in Figure 10. The calibrated gamma curve and the target gamma curve are both plotted on the diagram. The target gamma curve is gamma 2.2. Gamma curve can be described as how smoothly black transits to white on a digital display. During the factory calibration process, a gamma correction process is applied to ensure that the gamma level of the monitor is corrected so that its gray level will be displayed smoothly. Most of the time, the calibrated gamma curve is overlaid with the target gamma curve since we pay special attention to this check item and ensure the gamma curve is calibrated very carefully.
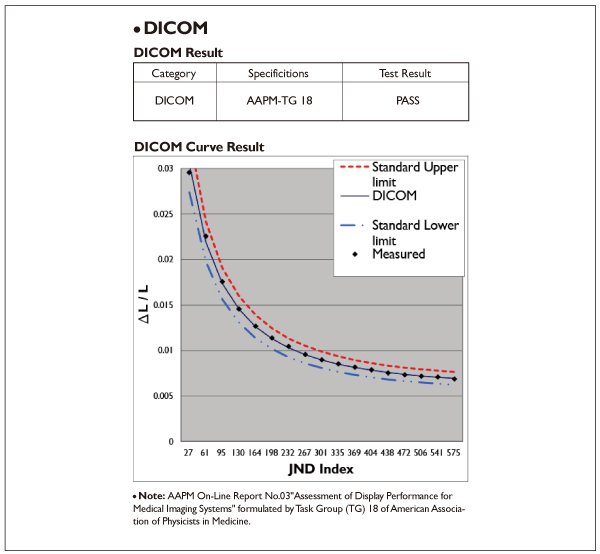
Last on the SW series calibration report is the DICOM section. DICOM is a medical standard for medical grayscale imaging devices or images, and stands for Digital Imaging and Communications in Medicine. It was established by AAPM TG-18, or the American Association of Physicists in Medicine Task Group 18. DICOM was established mainly for viewing grayscale images with an emphasis on shadow areas, for example, digital x-ray images. The DICOM curve is basically a specially-adjusted gamma curve to serve this purpose, and is luminance-dependent. Since it is a medical application, it requires an upper limit and a lower limit, and the limits are 10% of the standard curve. In the diagram, all DICOM standard curve, upper limit, and lower limit are plotted, as well as the 18 measurement points. If all 18 measurement points are within the limit boundaries, then it will show a ‘Pass’ in the Test Result on the upper right corner. If any one of the measurement points is out of the limit boundary, then it is a ‘Fail’. The strict requirement is to ensure the viewer can diagnose the x-ray images properly.
Figure 10: Gamma Section in SW Series Calibration Report
Figure 11:DICOM Section in SW Series Calibration Report
Get One Free Year Pantone Connect
Both the BenQ DesignVue Designer Monitor PD series and PhotoVue Photographer Monitor SW series monitors go through factory calibration, but the process is slightly different for each series. Therefore, the calibration report presented is also slightly different. On the calibration report for PD series monitors, color gamut, Delta E, gamma curve, and color temperature are shown. And each of these items was explained in detail in previous paragraphs. For SW series monitors, color gamut, Delta E, gamma curve, color temperature, uniformity and DICOM curve were adjusted, and these were all reflected in the calibration report. These items were also fully discussed in previous paragraphs as well. Now, we have a better understanding of the importance of the calibration report, and we also can interpret what the data means and appreciate how well the monitors are calibrated.
Find Out How AQCOLOR Technology Creates Accurate Colors
{{item.productWordingTag}}
{{currency}}{{item.finalPrice| numberThousandsCommas | numberDecimalPoint}} Save {{currency}}{{item.saveAmount | numberThousandsCommas | numberDecimalPoint}} Save {{item.savePercent | numberThousandsCommas | numberDecimalPoint}}%
new device price{{currency}}{{item.regularPrice| numberThousandsCommas | numberDecimalPoint}}