{{item.name}}
Price: {{currency}}{{item.price| numberThousandsCommas | numberDecimalPoint}}
Qty: {{item.amount}}
Accessories
How do We Define ‘Accurate’ Color? How we could quantify color in an ‘accurate’ fashion? Before jumping into this topic, let’s talk a little bit more of why the quantification of color is important to photographers, designers, imaging professionals, people in textile industries and more.
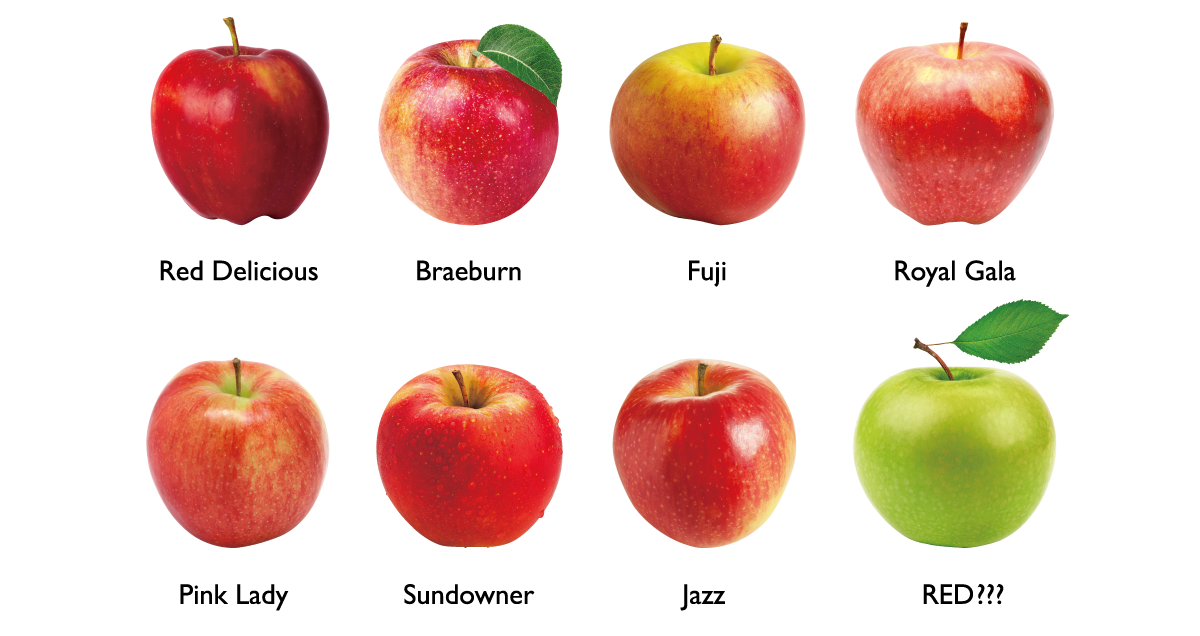
When we try to describe a color, the most common way of doing it is to refer to an object with the color in mind. For example, when we describe the color ‘red’, people will usually use ‘apple’ to describe ‘red’. But what kind of apple are we talking about? Are we thinking about the same apple? Look at Figure 1, there are at least seven different shades of ‘red’ among different varieties of apple. Not to mention the last one; it’s not even red! Therefore, there are discrepancies when we use objects to describe colors. And we need to find a way to reduce the discrepancies in a communication.
Figure 1: Different varieties of apples
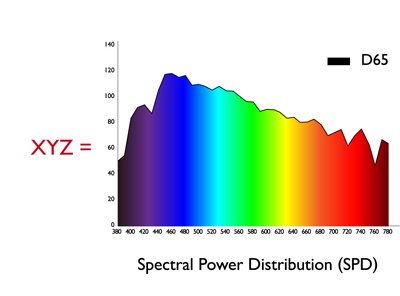
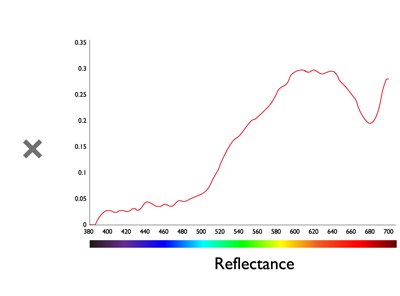
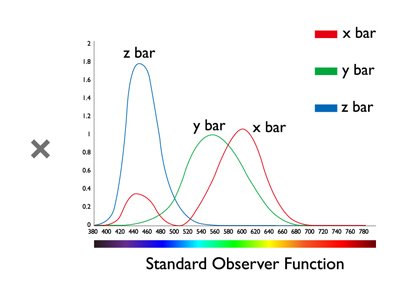
Humans tend to use ‘numbers’ to express an accurate measurement. For example, we use numbers to describe length, weight and etc. Therefore, we need a way to express colors in numeric forms, so we could say color A and color B are the same because they have the same numeric values. Back in 1913, CIE (Commission Internationale de l´Eclairage) defined Tristimulus Values (XYZ values) for quantifying the colors humans can perceive. The XYZ values are constructed by multiplying the following three attributes: the spectral power distribution of the light source, the reflectance of the object, and the Standard Observer functions to describe the characteristics of the human visual system. As a result, when color A and color B have the same XYZ values, we could say color A and color B look the same.
Figure 2: Formula for calculating XYZ values
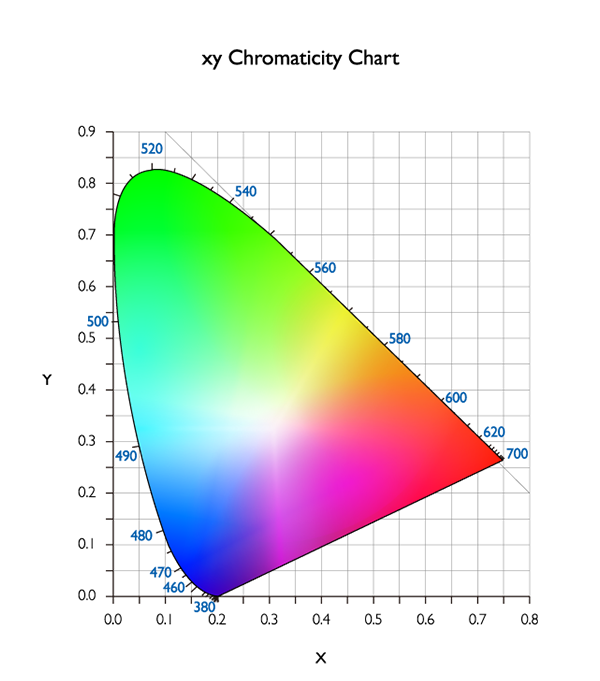
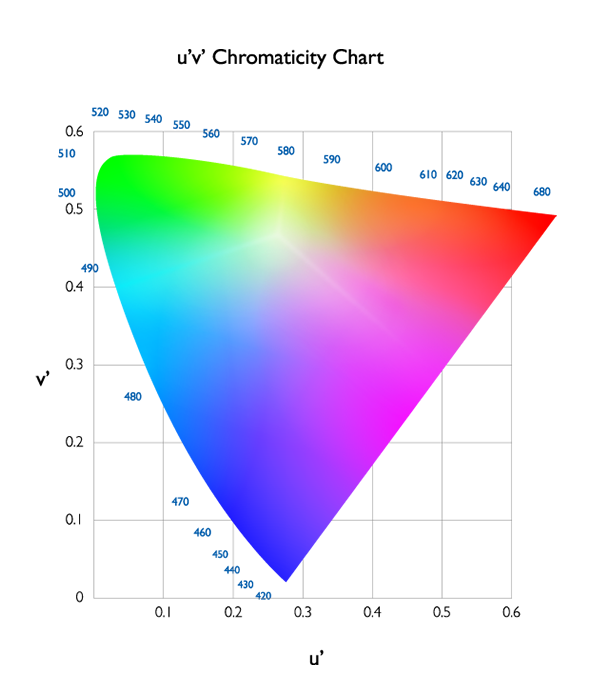
Another advantage of defining colors in numeric values is that we could easily express colors in a diagram with a coordinate system. And this forms a color space. Figure 3 shows the 1931 CIE xy chromaticity diagram, which represents all the colors that humans could perceive. However, this diagram does not truly reflect the sensitivity of the human visual system. Take blue and green, for example. Humans are very sensitive to blue and less sensitive to green: a little bit more of red we recognize as purple, and a little bit of green we recognize as cyan. This phenomenon is not reflected in Figure 3, a CIE 1931 xy chromaticity diagram. As a result, in 1976, the u’ v’ chromaticity diagram was proposed to reflect the sensation of the human visual system.
Figure 3: CIE 1931 xy chromaticity diagram
Figure 4: CIE 1976 u’v’ chromaticity diagram
Now, we have defined a system to describe colors in numeric form.
We could use a ruler to measure length, and use a scale to measure weight. When we measure colors, we need to measure light first. Measuring light is not as easy as using a ruler or scale, but there are instruments out there to help. For example, we could use a spectroradiometer to measure the spectral power distribution of the light.
However, these instruments are bulky and expensive, and they are not easy to carry around. Therefore, a more simplified device called ‘colorimeter’ was developed. A colorimeter measures light through a set of XYZ filters, so the speed is faster than spectroradiometer, but with less accuracy.
*XYZ filters: Optical filters to mimic the optical characteristics of XYZ values (tristimulus values) in terms of transmittance per wavelength.
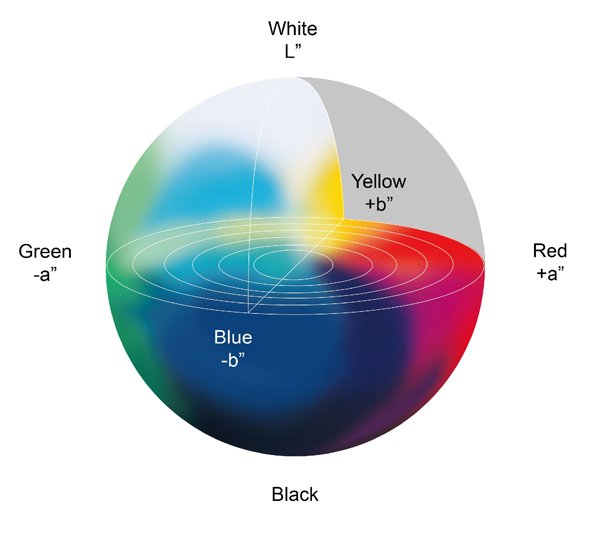
As stated earlier, when we have a set of XYZ values with the same numbers, we could say these colors look the same. But there are occasions when the XYZ values are not the same, but they still look very similar. For example, when we see a bright light in a bright room versus a dimmer light in a dim room, the measured XYZ values are not the same (due to different light intensities, but we still perceive the same color of light. This is due to the adaptation of our visual system. Another scenario is to compare the colors from different media. For example, one from the monitor and one from the printed paper. Hence, we need another metric to quantify this adaptation phenomenon. L*a*b* color space (shown in Figure 5) was then proposed and built for this ‘normalization’ purpose. It defines the brightest level of light in a scene or a media (e.g. paper) as 100, and normalizes all other colors in the scene or media according to the brightest light. As a result, now we can compare light with different intensities or colors from different media.
Figure 5: L*a*b* Color Space
When we look at two similar, but slightly different colors, we will wonder how close these colors are? Without using numeric values to represent colors, we could say “it’s close”. But how close? And what is the definition of ‘close’ since the perception of colors vary from person to person. With the XYZ color space or L*a*b* color space, we can quantify the difference between colors. By calculating the distance between two colors in a particular color space (L*a*b* color space is usually used), a difference value can be obtained. This difference value is called ‘Color Difference’. We usually use delta E* for designating ‘Color Difference’.
The simplest version of the color difference formula is called delta E* 76 ( delta E*ab).
A more complex formula is used in textile and graphic arts industry. It was announced in 1994, hence it is called delta E* 94.
In 2000, researchers developed a newer version of the color difference formula to truly reflect what the human visual system perceives. It is called delta E*2000 (delta E*00). Due to large amount of research studies to achieve high correlation between the calculated values and human perception, delta E*00 has now become International Standard, and is recommended to be used in all scientific research work.
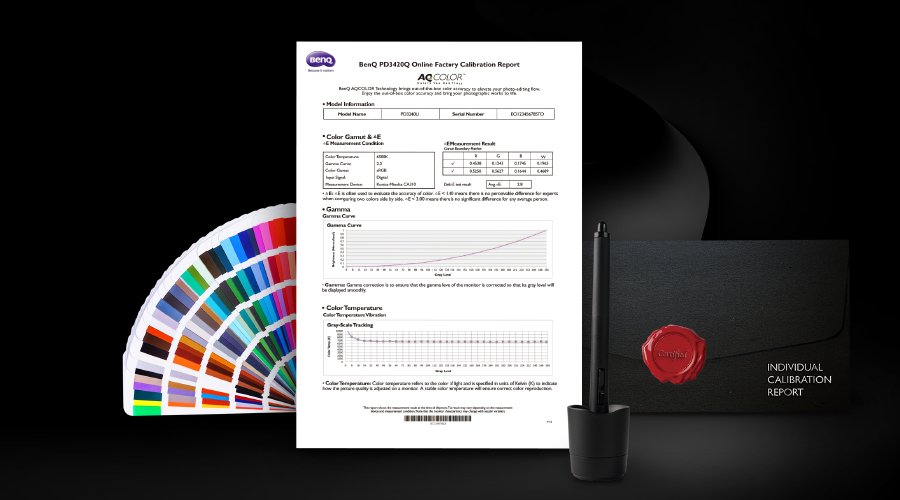
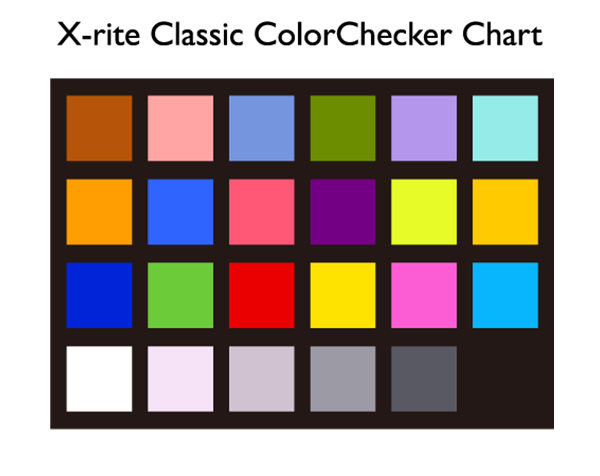
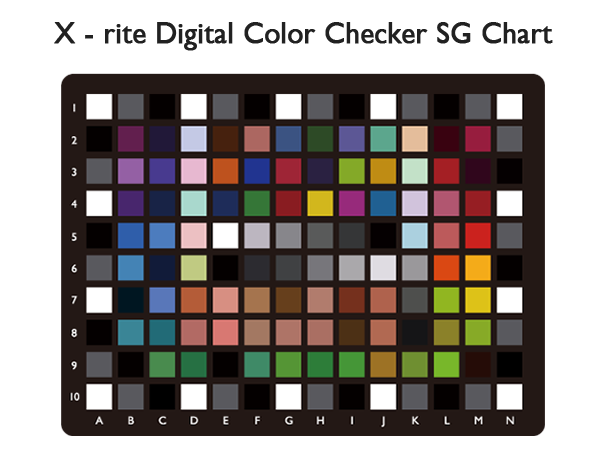
As we have seen in the formulas above, two sets of L*a*b* values are required. If we need to judge the accuracy of a particular color, then a set of measured L*a*b* values and a set of defined L*a*b* values are required. We could obtain the measured values using the instruments mentioned earlier, but how do we obtain ‘defined’ or ‘standard’ values? The ‘defined’ or ‘standard’ values can be obtained by using standard charts (Figure 6). These color charts have defined L*a*b* values for all the colors in the chart, and each chart are produced very carefully to meet the tolerance. Hence, these charts could be used as a reference since the values will not change.
To judge the accuracy of a color, delta E*00 is often used. delta E*00 < 1.00 means there is no perceivable difference for experts when comparing two colors side-by-side. delta E*00 < 3.00 means there is no significant difference for typical person. (The experts mean color science professionals or experienced photographers, designers, imaging professionals, etc.)
In summary, we have learned about how to use numbers to define colors and the reason behind it. We have also identified the differences between each color space, such as XYZ and L*a*b*. And lastly, we learned ways to measure color, and how to define color differences. Using delta E*00 values, we can judge if the color is accurate or not.
Figure 6-1: X-rite Classic ColorChecker Chart
Figure 6-2: X-rite Digital ColorChecker SG Chart
Get One Free Year Pantone Connect
$90 value
Find Out How AQCOLOR Technology Creates Accurate Colors
{{item.productWordingTag}}
{{currency}}{{item.finalPrice| numberThousandsCommas | numberDecimalPoint}} Save {{currency}}{{item.saveAmount | numberThousandsCommas | numberDecimalPoint}} Save {{item.savePercent | numberThousandsCommas | numberDecimalPoint}}%
new device price{{currency}}{{item.regularPrice| numberThousandsCommas | numberDecimalPoint}}


![How to Choose the Best Monitor for Mac® Devices [2024]](https://image.benq.com/is/image/benqco/mac-monitor_thumb?$ResponsivePreset$)